Introduction to Salesforce Reports
A report is an important part of any business. It provides a clear view of the management. An administration uses the reports to trace improvement towards its different goals, control expenses and increases profits. In Salesforce, we can easily create reports in different styles.
Reports can be created using a few clicks in a short time. We can also schedule the Salesforce reports.
There are basically four types of reports that we can create:
1. Tabular: It is used for listing a simple collection of data without any subtotals. This provides us a view to look at the data with no groupings. By default, it provides a Grand Total, to sum up, the number of records that fall in the applied condition.
2. Summary: It is used for the listing of data with groupings and subtotals. We can use this when we want subtotals based on the value of a particular field or create a hierarchically grouped report, such as courses organized by created date and then by course created by.
3. Matrix: It allows us to group records both by row and column. We can use it to make a comparison of related totals, with totals by both row and column. We can use it when we want to see data by two different dimensions that aren’t related, such as date and product.
4. Joined: It is used for blocks of related information in a single report. This type of report enables us to adopt five different blocks to display different types of related data. Each block can own unique columns, summary fields, formulas, filters, and sort order. One can use this type of report to regroup and show data from multiple report types in different views.
Below is an example of a report for a custom object called “Courses”. We will create all four types of format.
- Go to Setup.
- Find Report Types in Quick Find search box.
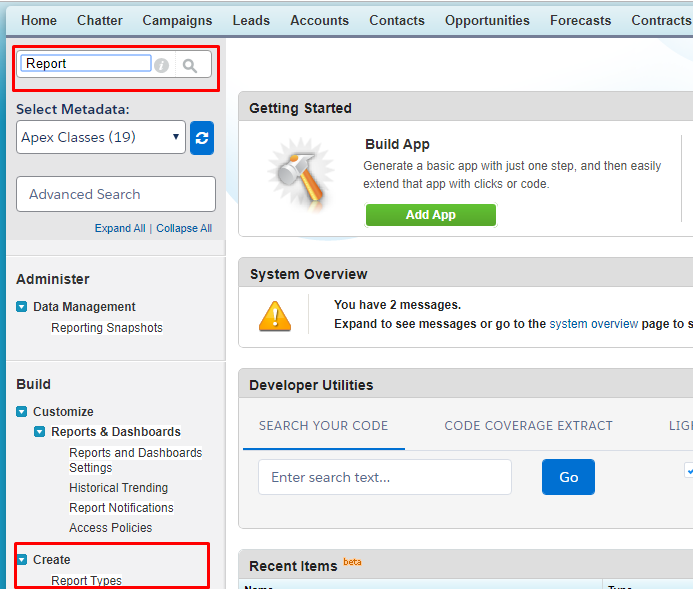
- If you are creating a Report for the first time, below screen will appear.
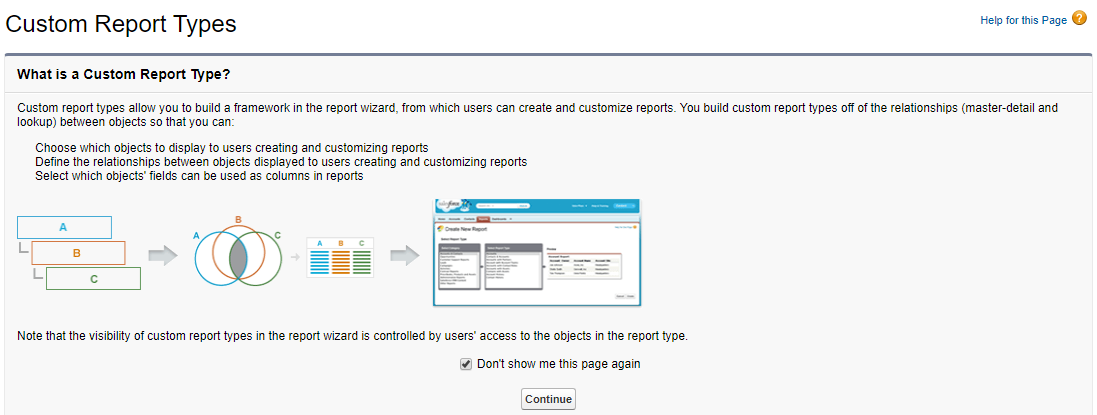
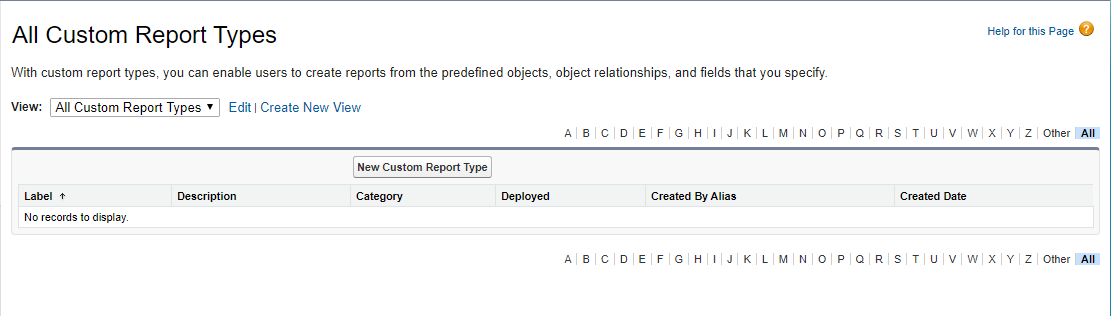
- Create a new Report type.
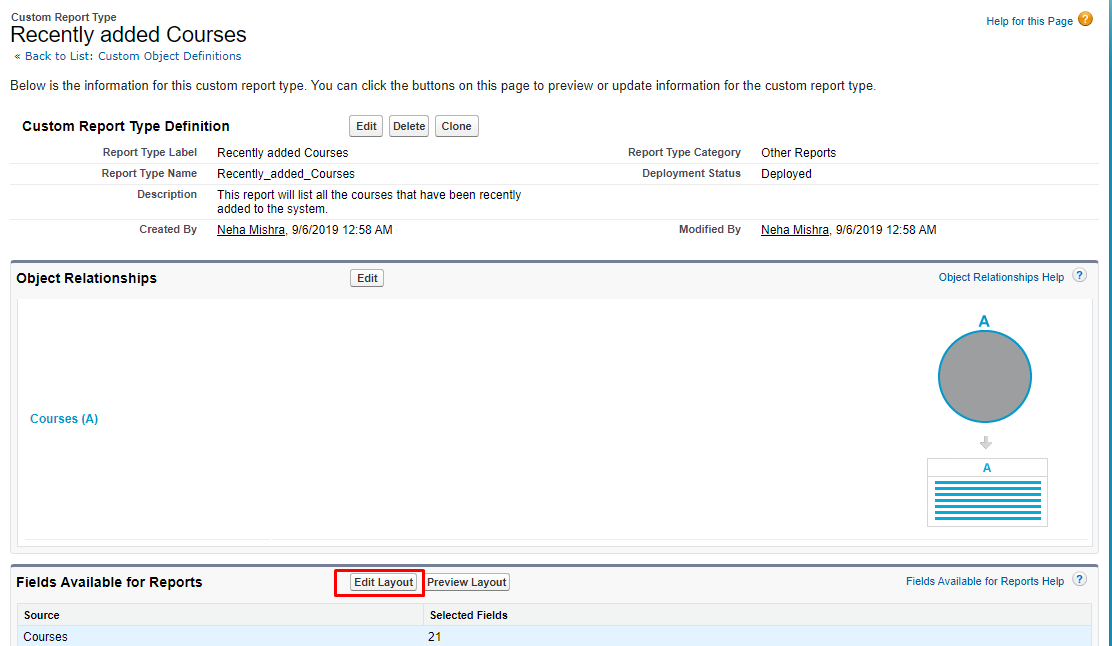
 Fill all the required fields as shown below, and make sure you set the Deployment status as “Deployed”.
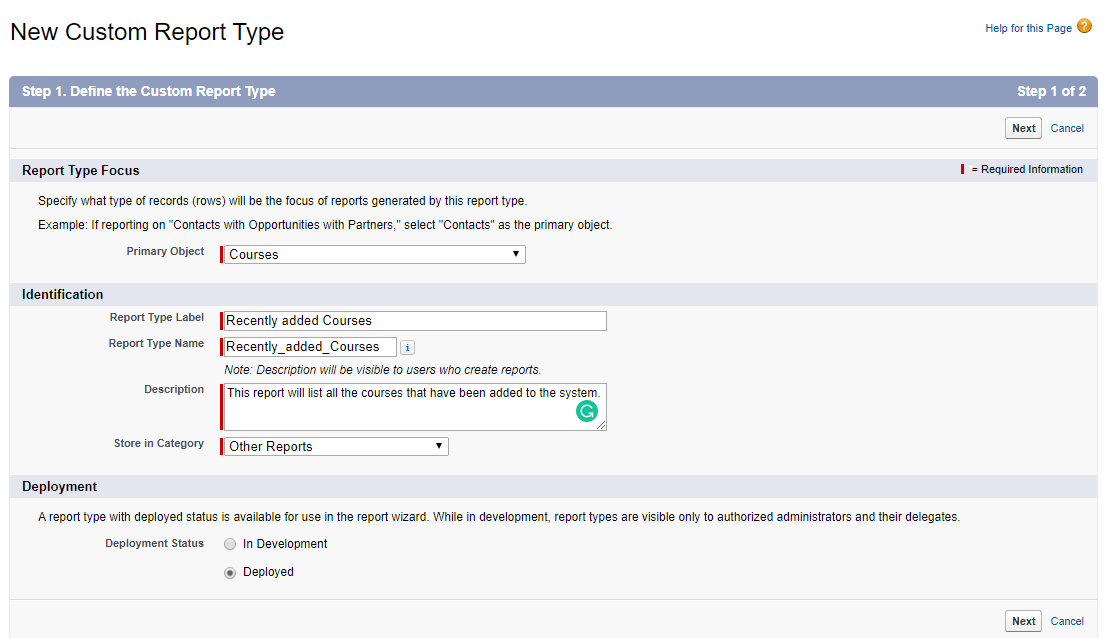
- By default, all the fields will be added to the report types. In case some new fields are created after creating the record type, click on the Edit layout and drag and drop the fields you want. (See below)
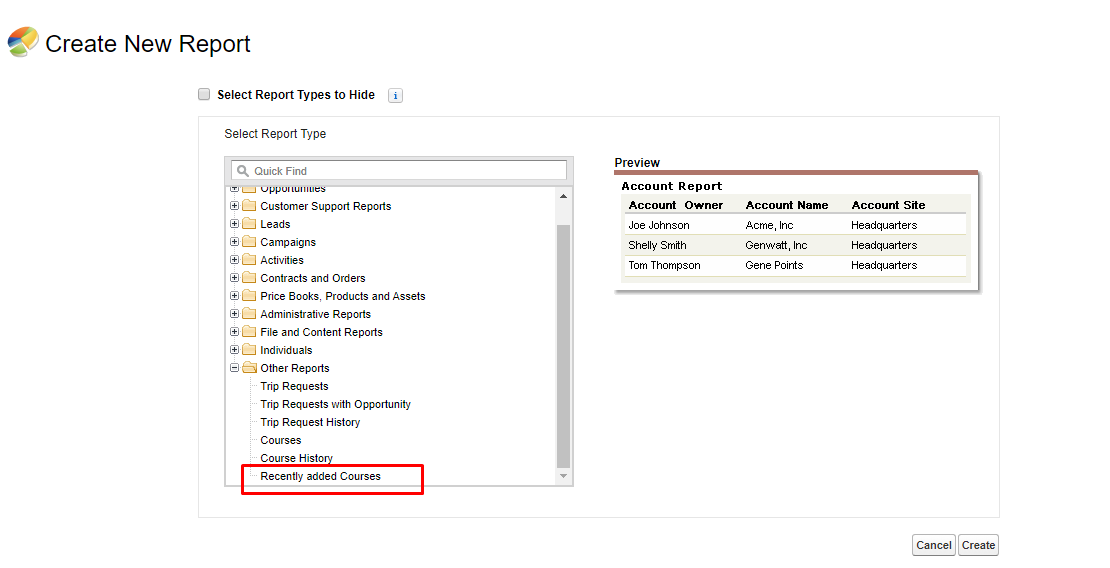
- Now let us create a new Report. Go to the Reports tab, and click on New Report. Go to the category in which you created the Report types, expand and select your report type. Click Create.
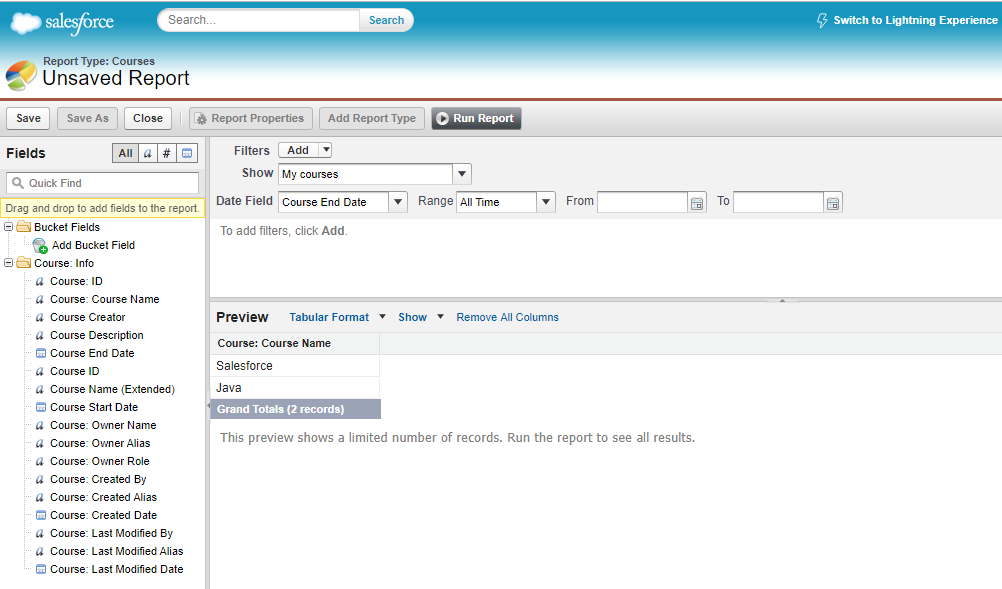
- Drag and drop fields that you want to list in the report.
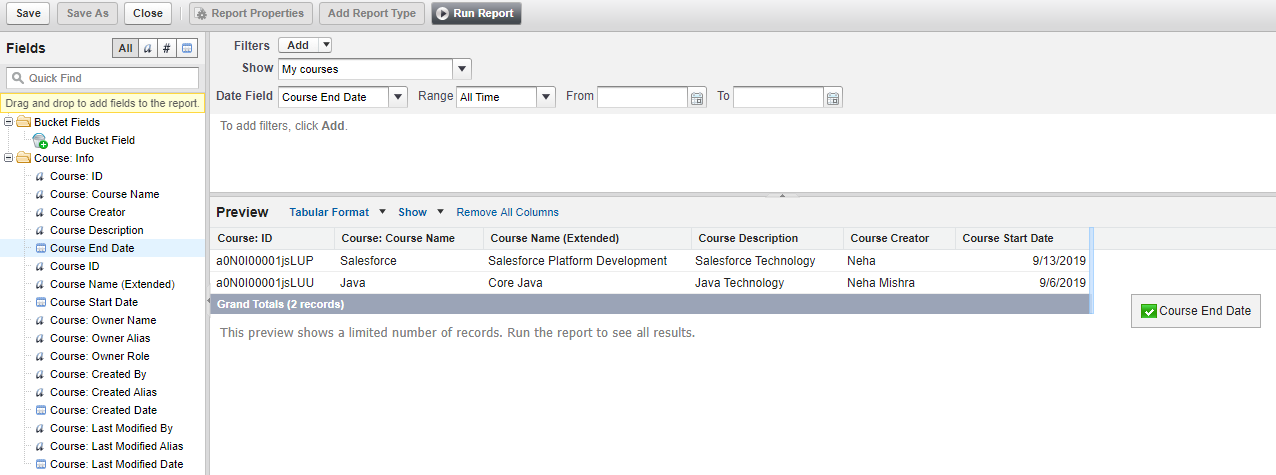
- Apply date-filter to filter records accordingly.
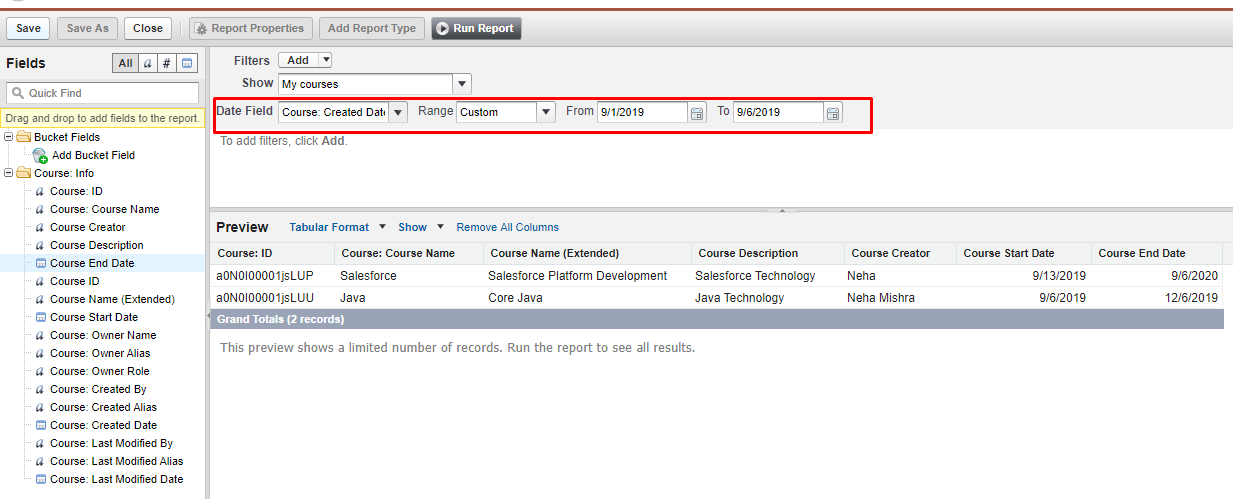
- Click on Save, set the Report type name and click on Ok.
Go to the Reports tab again.
You will see your new report created on the right section of the panel.
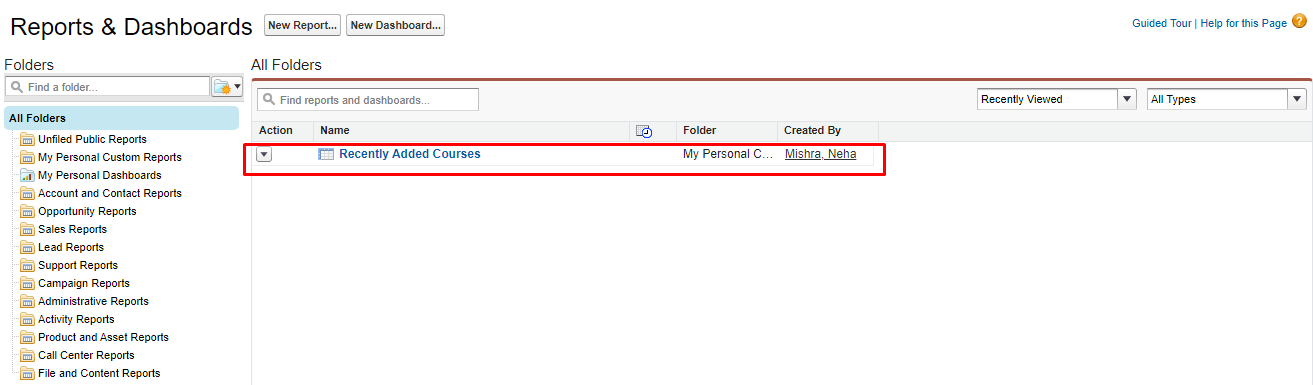
- Select your report and click on the Run Report button.
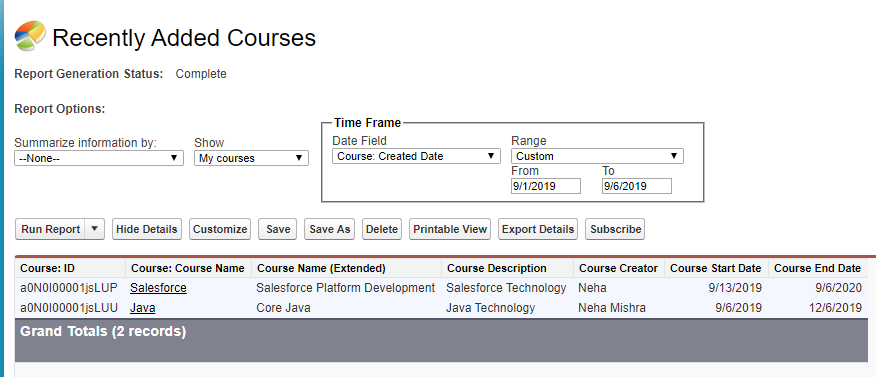
This is a Tabular Report example.
We can customize to update the structure of the report.
Let us try the rest of the formats.
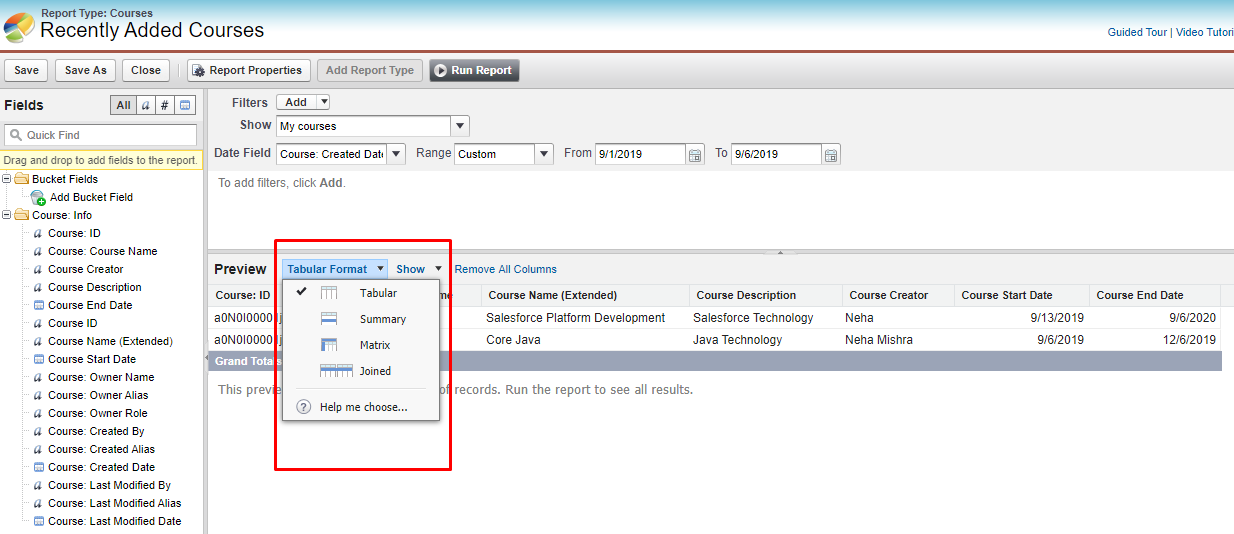
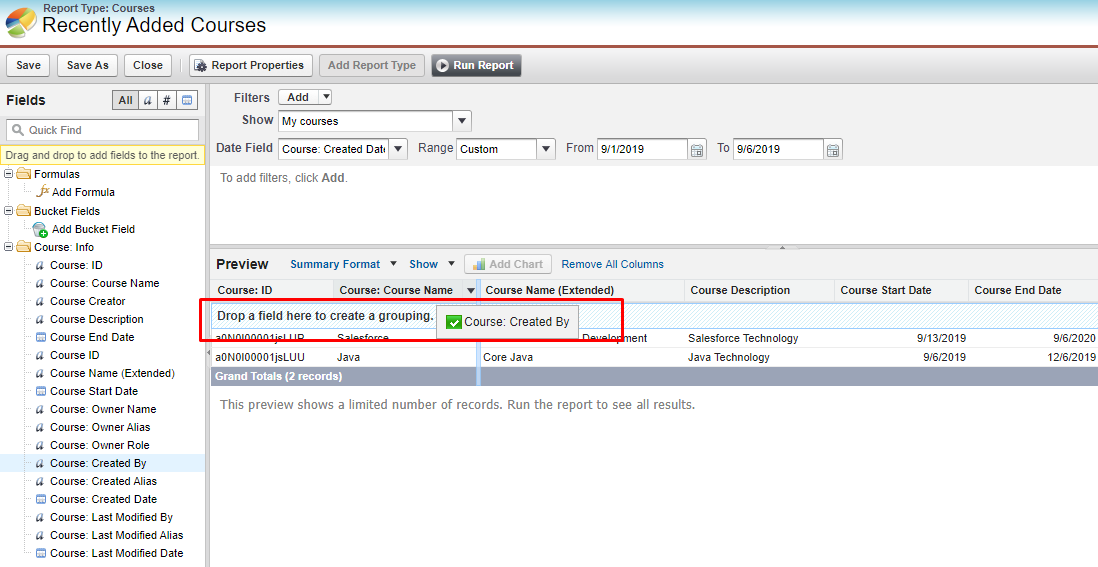
- Click on the Customize button. On clicking the down arrow beside the “Tabular Format”, you will see other formats.
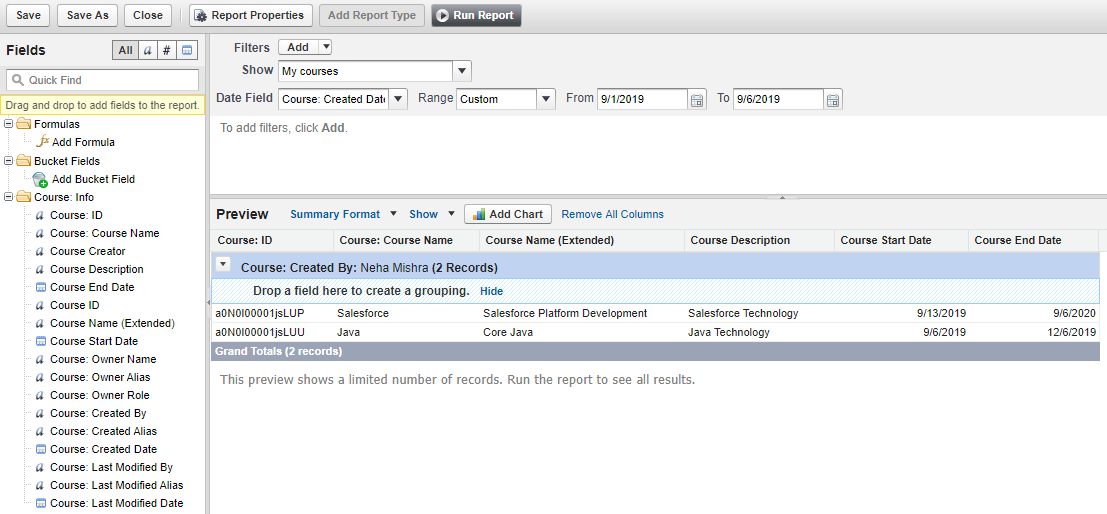
- Select Summary Format. Drag and drop a field to create a grouping.
Click on Save.
- Select Matrix Format. Drag and drop a field to create a column grouping.
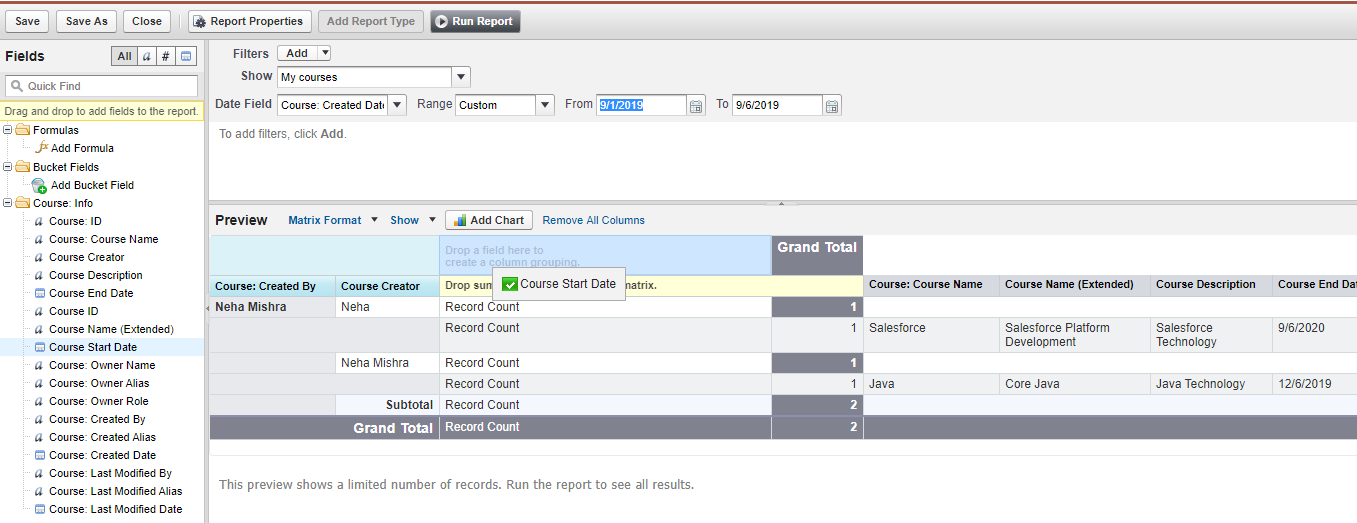
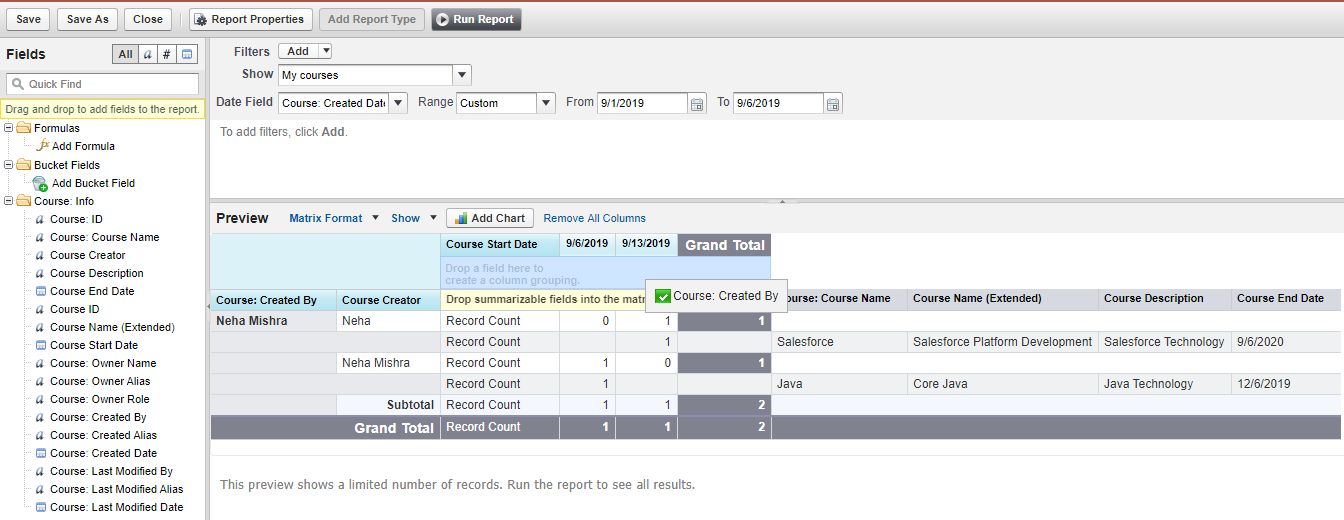
If required, drop summarizable fields into the matrix.
Click on Save and Run Report.
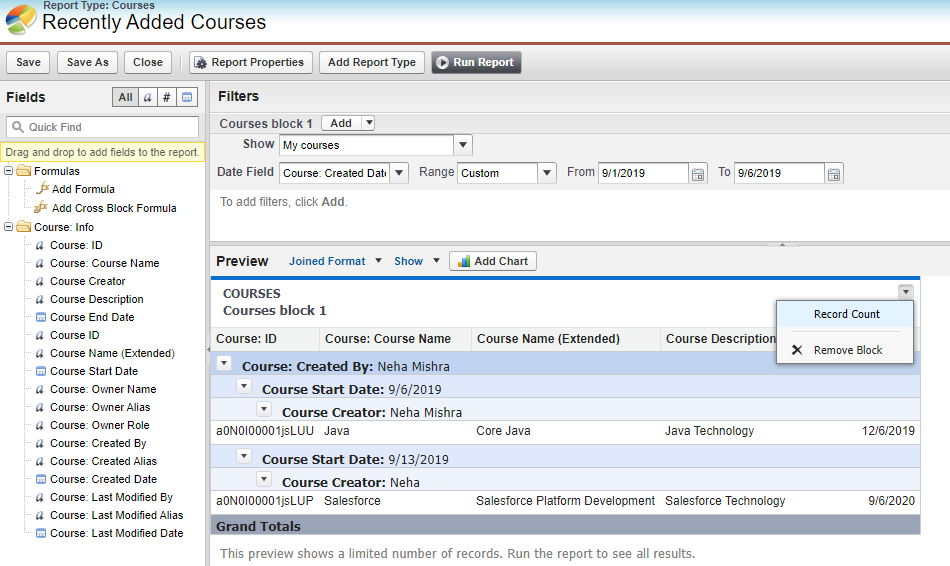
- Select Joined Format. Drag and drop a field to create a column grouping.
If you want to remove the Record Count, go to the down arrow on the right-most side (see below), and uncheck the Record Count. You can keep it if you want to show it in your report.
- Click on Save and Run Report.
Enjoy Creating Reports!
[sc_fs_multi_faq headline-0=”h3″ question-0=”What is a report?” answer-0=”A report is an important part of any business. It provides a clear view of the management.” image-0=”” headline-1=”h3″ question-1=”How do administration use reports?” answer-1=”An administration uses the reports to trace improvement towards its different goals, control expenses and increases profits.” image-1=”” headline-2=”h3″ question-2=”What are types of reports in Salesforce?” answer-2=”There are basically four types of reports that we can be created in Salesforce: 1. Tabular: It is used for listing a simple collection of data without any subtotals. 2. Summary: It is used for the listing of data with groupings and subtotals. 3. Matrix: It allows us to group records both by row and column. 4. Joined: It is used for blocks of related information in a single report.” image-2=”” headline-3=”h3″ question-3=”Which type of Salesforce report can be used to regroup and show data from multiple report types in different views?” answer-3=”Joined reports can be used to regroup and show data from multiple report types in different views.” image-3=”” count=”4″ html=”true” css_class=””]


Leave A Comment